Introduction
Gathering from the years of experience of our expert BI / Analytics consultants who have worked with the world’s leading retailers in architecting, implementing & optimizing their BI & Planning solutions. Today, we bring to you some insights into the industry practices across the retail industry in managing their enterprise performance suite and we will see how SAP Analytics Cloud (SAC) fits in the overall picture. We will also address the topic of how SAC can enhance the existing SAP landscape to enable businesses to make better-informed decisions. But before that, let’s outline few common requirements, as well as the KPIs, used across multiple retail clients that we’ve worked with:
Requirements/KPIs Used:
- Many of our retail clients have a physical location / Store / Plant or we can say profit centers where the majority of the sale happens. This calls for a chargeable area as one of the most important drivers used across multiple KPIs. A major chunk of retail clients’ expenses consists of the occupation cost, so this ratio of sales per square feet and similar KPIs which involve chargeable area are important. This concept is a proxy to unit economics and its threshold values vary across geographies owing to the occupation cost per square foot.
- Besides the Brick & Mortar model, many of our retail clients deal with multiple business partners such as e-commerce partners, etc. An Omni-channel approach to the retail business is required, and reporting such sales constitutes a whole other gamut because the cost of such sales cannot be compared with the ones done with the brick-and-mortar model.
- And one of the major indicators of annual performance in the Retail industry is like to like-to-like or LTL growth of the business. Such reports are important to understand the actual performance improvement in the stores that were already operating under a given retail company for over a year.
In addition to the above requirements, the next segment discusses the number of common KPIs tracked across almost all the retail clients that we’ve worked with.
KPI’s every Retail Manager needs to track
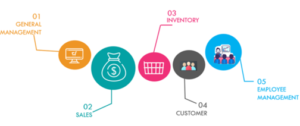
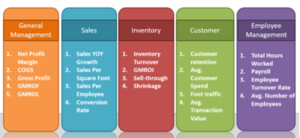
Understanding which KPIs are the most important for your business to track is the first step in designing a BI solution. Based on the usage across multiple functional units in an organization, we can classify the KPIs required in a retail company into 5 main categories:
General Management Analytics
This includes the key financial metrics that allow managers in retail to track the overall performance of the business and call for action in case the KPIs are aberrant.
-
Net Profit Margin
It measures the percentage of profit made after deducting all the expenses, interests, depreciation, and taxes from revenue. It represents how good the company is at converting revenue into profits.
-
Margin %
Retailers sell a product mix and plan margin % instead of COGS. Different product types have different margins % and this KPI helps track whether the company is in the standard range of margin. This information is key in determining how to outsell the competition.
-
Gross Profit
This metric represents the retail’s financial health and shows how successful the organization is at generating a high return. The difference between the Sales Revenue and COGS calculates it.
-
Gross Margin Return on Footage (GMROF)
GMROF shows the relationship between total sales corresponding to per square feet area of the store.
-
Gross Margin Return on Labor (GMROL)
GMROL is a measure of employee productivity that expresses the relationship between gross margin and FTE. It explains the profit gained by an FTE in a specific period of time.
Sales Analytics
KPI tracking linked to sales activities helps to increase the performance of your stores by taking corrective measures if the sale is plummeting. Their monitoring over time allows retail managers to do sales forecasts.
-
Sales year over year Growth
Sales growth is the percent growth in the net sales of a business from one fiscal period to another.
-
Sales Per Square Foot
Sales per square foot is one of the best metrics for gauging and comparing the performance of brick-and-mortar stores. It’s a good indicator of store productivity, and it can also tell you if you’re making good use of space and fixtures in your shop.
-
Sales Per Employee
This metric will give you an important point of view about how efficiently employees are being utilized.
-
Conversion Rate
This generalized KPI offers insight into what turns visitors into customers. Marketing campaigns can get people to stores but the only way to grow is to ensure visitors convert into paying customers.
Retail Sector Key KPI’s
Inventory Analytics
Retail inventory management enables store managers to quickly analyze the stock of different articles, optimize it, and offer customers excellent services. A few key KPIs are:
- Inventory Turnover / Stock Turn
Stock turn is a critical metric for determining optimal inventory levels. If the stock turn is too low, then it means you’re not selling out of inventory fast enough and risk carrying slow or dead stock. If the stock turn is fast then it could mean that customers are continually dealing with out-of-stock issues.
-
Gross Profit Margin Return on Investment (GMROI)
This metric is an inventory profitability evaluation ratio that measures the profit return on the funds invested in the stock. It measures for each dollar invested in inventories how many dollars your company has been able to recover.
-
Sell-through
Sell-through is a great way to evaluate merchandise performance. It also helps you figure out the speed at which a product is selling so you can make the right purchasing decisions.
-
Shrinkage
Shrinkage pertains to a loss of inventory that isn’t caused by actual sales. The common causes of shrinkage are employee theft, shoplifting, administrative errors, and supplier fraud.
Customer Analytics
1. Customer retention
The customer retention definition is the process of engaging existing customers to continue buying products or services. The best customer retention tactics enable you to form lasting relationships with consumers who will become loyal to your brand.
2. Average Customer Spend
This KPI metric offers to understand deeply the client’s segment. This data can be further analyzed to understand customer values and preferences.
- Foot traffic
Foot traffic refers to the number of people who walk into your store measured using people counters and retail analytics software. Analyzing this metric over time allows retailers to identify hours or seasonality when it need more or less staff. It also enables marketing teams to evaluate the success of a campaign.
- Average Transaction Value
Transaction value measures how much customers spend on average on each purchase. The KPI is a useful tool for determining pricing and product strategy.
Employee Management Analytics
1. Total Hours Worked
Total work hours enable comparison between income and working hours and help understand employee satisfaction.
2. Payroll
This KPI measures the total amount of money paid to the employees.
3. Average Number of Employees
The average Number of Employees per store is an important KPI metric for successful store management. It helps analyze the optimum number of employees that should be hired at the right time.
4. Employee Turnover Rate (ETR)
It shows the number or percentage of workers who leave and are replaced by new employees. ETR provides insights into the workplace culture, employment packages, and work environment.
How SAP Analytics Cloud innovates the retail BI solution
SAP Analytics Cloud supports integration with almost any available tool across the industry. But you get the most out of it if you’re using it with BW/4 HANA, BPC4/HANA, and S4/HANA. With SAP suite of products, it provides the capability of live data streaming. It is an industry-leading cloud tool for BI modeling and Reporting along with Predictive Analytics and Planning capabilities.
In the context of retail, it supports the creation of master data directly from the dashboard which helps planners to create new dummy stores, marketing managers to plan out the cost of new campaigns, etc. SAP Analytics Cloud has a cutting-edge dashboard design tool with predictive analytics integrated which assists decision making a larger extent.
At the group company level, organizations can implement SAP Analytics Cloud, while subsidiaries may have a heterogeneous set of ERPs or BI solutions implemented. It can easily integrate with a heterogeneous set of ERPs and provide reports from a single source of data. It also eases the integration of data flow from newly acquired companies into the SAP Analytics Cloud to support reporting at the group level.
Retail Dashboards using SAP Analytics Cloud
Since we’ve listed the common KPIs required in retail, let’s jump into the implementation part. SAC aids in visualizing and reporting all-important retail KPIs in one central interface, turning the staged data into actionable insights. SAP Analytics Cloud (SAC) provides business intelligence (BI), augmented analytics, predictive analytics, and enterprise planning – in a single solution. These features, combined with the data visualization techniques of SAC can be used to create interactive dashboards that every retailer can benefit from.
Advantages of SAC for Retail Dashboarding
- SAC provides an integrated solution covering BI, Predictive, and Planning – in one tool.
- The live data connection can be set up in SAC which can be used for real-time analytics. The data can be imported from different data sources ex: S/4 HANA, SAP BW4/HANA, SAP BPC4/HANA, etc.
- Data can be imported to SAC by setting up an import data Connection with different systems ex: SAP S/4 HANA, SAP BW/4 HANA, SAP Success Factor, Google Drive, SalesForce, SQL database, Excel, etc. This enables users to combine live and acquired data from different SAP, and non-SAP systems and create a unified dashboard that serves as a single point of truth.
- SAP Analytics Cloud Digital Boardroom feature helps transform board meetings into immersive and customized experiences.
- SAP already provides standard Business Content within a number of Industries and LoB’s for end-to-end business scenarios which can be modified/customized as per our requirements.
Ex: Retail – Model Company Core Retail (RT-MC) Business content, Retail – Model Company Fashion for Vertical Business containing dashboards related to sales analytics based on live connection with SAP CAR (Customer Activity Repository).
Retail – Omnichannel Article Availability and Sourcing providing sourcing, article availability, and consignment details based on BW live connection to SAP Customer Activity Repository (CAR) data with dedicated CDS views.
Below are some of the SAP Analytics Cloud dashboards delivered by SAP as part of the standard business content for the Retail Industry:

Some sample SAP business content dashboards are shown below :
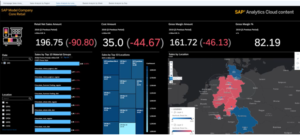
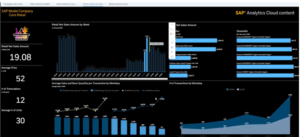
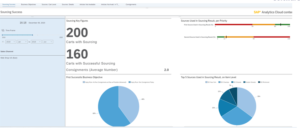
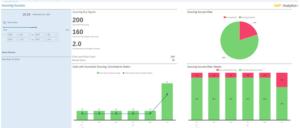
SAP Analytics Cloud Standard Business Content from SAP
The above snippet shows the standard business dashboard provided by SAP. SAC is capable of geographical data representations, balanced scorecards, pie charts, tiles, predictive analytics (shown in the top right snippet), slice & dice, etc. Besides this SAC allows for cross-chart filtering where you can filter the contents of one chart and get the impact on the other charts connected inside the same storyboard.
Custom Dashboards Created using SAP Analytics Cloud
Below are the custom dashboard built by our consultants with respect to requirements in a retail company
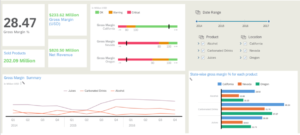
Summary/Overview Page
The above Dashboard provides a summary of Sales & Margins. It provides a single-page summary to understand how the company is performing. The business user can filter the data based on the products hierarchy and location hierarchy
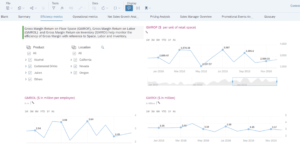
Efficiency Metrics Page
The above dashboard focuses on efficiently utilizing resources to achieve profits. It represents widely used KPIs (GMROF, GMROL & GMROII) in retail as line graphs. It includes filters based on product hierarchy and location hierarchy. You can further customize the dashboard to add more filters like legal entity or company and additional visualizations.
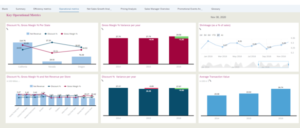
Operational Metrics Page
Above Dashboard shows the operational metrics used in Retail: Gross margin%, Discount%, Shrinkage%, and Average Memo/ transaction size.

Cost Analysis, Forecast, and Smart Insights
The above Dashboard shows the SAC’s capability of artificial intelligence. You can click on smart insights and SAC analyses the data and provides you interesting insights about the dimension you are focussing on. This can help cost accountants to do an exploratory analysis of unexplained costs across product lines.
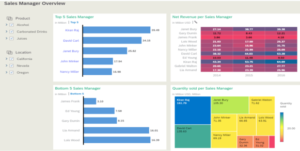
Sales Manager Overview Page
We developed the above dashboard to track sales by employees. The bottom right graphical representation helps a lot in easily visualizing of %age contribution of multiple employees in the sales. This provides quite a clear representation as compared to pie charts. Users can utilize the smart insight feature on any story and on any chart to navigate to outliers if required.
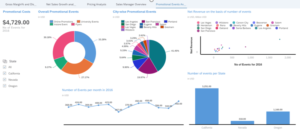
Promotional events tracking or Campaign tracking is very important with respect to marketing. The above dashboard gives a summarised picture of how many events have happened, where they have happened, what has been the cost, what is the associated revenue, and combinations of the formers with the location dimension.
Moreover, you can check our video blog also – SAP SAC Retail
To read more of our blogs you can surely click here.
Disclaimer: All the opinions are solely for information purposes and the author doesn’t recommend or reject any tools. You should perform this task after your own due diligence.
