SAP Analytics Cloud (SAC) – Unified Story Features
By Trijotech Team/ December, 2021Introduction:
The Optimized Story Experience from Unified Story in SAP Analytics Cloud (SAC) is a cutting-edge solution for creating and managing data visualizations, analytics applications, and interactive experiences. This innovative platform combines the best features of stories, analytics designers, and custom widgets with advanced scripting capabilities, allowing users to create highly customized projects tailored to their specific needs.
One of the key benefits of the Optimized Story is its versatility. It offers a wide range of capabilities, from simple self-service data visualization to more advanced analytic applications, all in one place. This makes it an ideal tool for anyone looking to create dynamic and engaging visualizations and applications, regardless of their level of experience or expertise.
Moreover, the Optimized Story makes it easy for developers and story designers to collaborate on projects, and for administrators to manage them. This streamlined workflow not only saves time and resources but also ensures that everyone involved in the project is on the same page.
One of the most exciting features of the Optimized Story is its ability to bookmark the entire widgets state. This means that users can easily revisit and resume their work exactly where they left off, without having to start from scratch. This feature not only saves time but also enhances the user experience, making it easier to navigate and manage complex projects.
Integrated Design Time for Both Designer and Developer
Story Widgets, such as panels, tab strips, page books, input fields, text areas, buttons, dropdowns, checkbox groups, radio button groups, sliders, range sliders, filter lines, and list boxes, were previously only available in analytics applications. Now, you can use them in stories as well.
Story designers and developers now have a single, integrated design environment to collaborate in, making it easier and faster to create interactive stories.
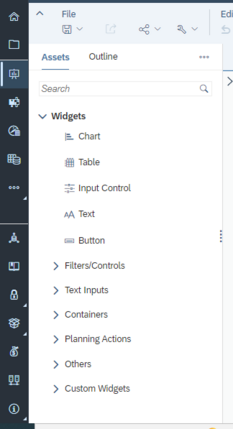
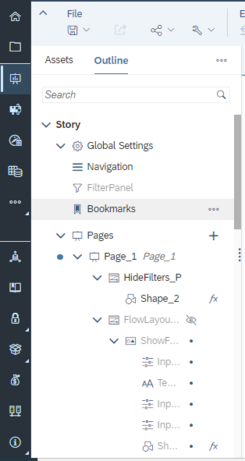
This environment includes the Assets panel, which allows users to drag and drop widgets onto the Story Canvas, and the Outline panel provides a structured view of the widgets in the story.
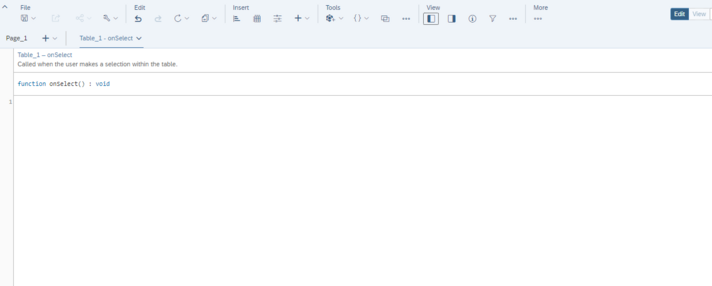
Advanced features such as filter controls, containers, buttons, scripting and event handling, performance analysis for scripting execution, and editing of Cascading Style Sheets (CSS) are available for those with the Application privilege. All of this is designed to keep the environment simple and clean for the story designer while allowing developers to leverage more advanced features.
But be aware, scripting is not yet supported for responsive pages, but this is planned for the QRC2/2023 Release.
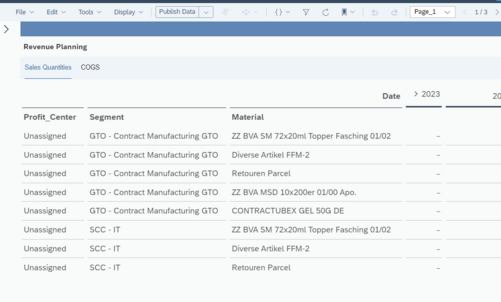
Filter Panel
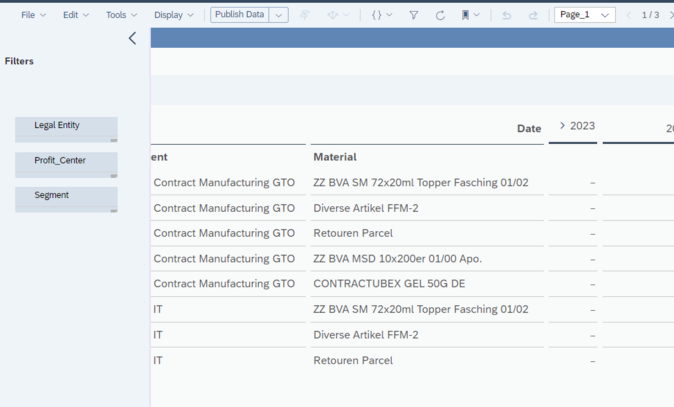
Story viewers now have more flexibility when interacting with filters in a story.
With the introduction of the new orientation feature, the filter panel can be switched from the default horizontal view to a vertical view.
This vertical view offers more space for displaying and interacting with filters, especially when dealing with hierarchical value lists.
Story designers can easily configure the default orientation that viewers will see when they open the story.
Bookmarks Concept
Optimized Story combined the concept of a story bookmark and an analytics app into one cohesive bookmark.
Consumers of stories can bookmark the entire widget state, including the filter, variable, and drilldown.
Optimized Story also introduced bookmark versions, which give users the option to adjust when their bookmarks expire.
Additionally, story developers can define which widgets can be included in the bookmark definition. Furthermore, they can enable the bookmark dialog in embedded mode at the story level through View Time Toolbar Settings.
Conversion Classic to the new Optimized Story
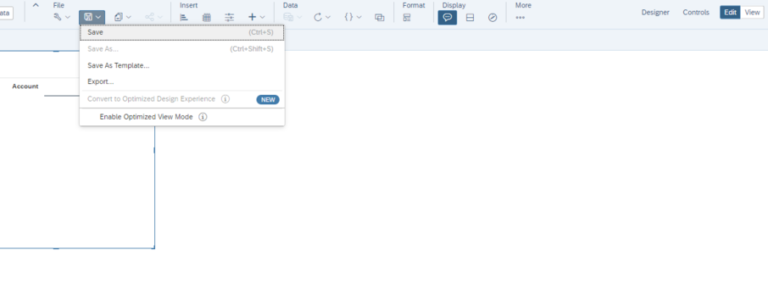
The introduction of the Optimized Story Experience has revolutionized the process of creating stories. This new feature has made it easier and more efficient for story designers and developers to convert their classic stories into a more modern format with just a single menu option.
With the Optimized Story Experience, users no longer have to spend hours manually converting their classic stories to the new format. Instead, all they need to do is open the story in the new Unified Story Experience, and the system will automatically convert it to the new format.
This makes the process of creating stories much more streamlined, allowing designers and developers to focus on creating engaging content rather than worrying about formatting and conversion issues.
In addition to its conversion capabilities, the Optimized Story Experience also offers a range of tools and features that make it easier to create engaging stories. These include drag-and-drop interfaces, intuitive menus, and real-time preview capabilities that allow users to see exactly how their stories will look and feel on different devices.
Overall, the Optimized Story Experience represents a major step forward in the world of digital storytelling, making it easier and more accessible than ever before. Whether you’re a professional storyteller or just getting started in the field, this new feature is sure to help you create compelling, immersive stories that captivate your audience and keep them coming back for more.
Conclusion
Unified Story Experience is a new and improved way to create Dashboards in SAP Analytics Cloud. The Optimized Story Experience from Unified Story is a revolutionary tool that transforms the way users create and manage data visualizations and analytic applications. It leverages the power of stories, analytics designers, and custom widgets with scripting capabilities to provide a plethora of features that enable story designers to personalize their projects. Moreover, the integration of story widgets, filter panel, and bookmark concept enhances accessibility and efficiency for designers and developers alike.
With its sophisticated functionality and user-friendly interface, the Optimized Story Experience is the ideal solution for designing captivating and dynamic visualizations and applications that elevate dashboard and planning activities to new heights.
This is a major step forward toward the new generation of Dashboarding in SAP Analytics Cloud. Happy Dashboarding!
To read more of our blogs you can surely click here.
Check out other video blogs.
Disclaimer: All the opinions are solely for information purposes, and the author doesn’t recommend or reject any tools. It should be done after your own due diligence.