SAP SAC

SAP SAC: Unlocking the Power of Data Connection and Data Sources

Introduction: – SAP SAC (SAP Analytics Cloud) is a cloud-based business intelligence and analytics solution developed by SAP. It enables organizations to perform data analysis, data visualization, and reporting in real-time. SAP SAC is designed as a comprehensive solution for addressing data-related needs, including planning, budgeting, forecasting, and predictive analytics. In this Blog we are going to focus on Data connectors and Data sources. SAP SAC Data Connectors: – Data connectors are tools that enable users to connect to and import data from various sources into SAC for analysis. SAC supports a variety of data connectors, allowing users to import data from databases, cloud storage, files, and live data connections. There are some common use of data connectors mentioned below: – SAP HANA Connector: – It gives an accessibility to connect with any SAP HANA system in an organization and an in-memory database used in SAP   Environment. SAP BW Connector: – This connector gives and access to connect with data stored in SAP BW (Business Warehouse) SAP S/4HANA Connector: – It gives organization to connect with SAP S/4HANA, an (ERP) System SAP BusinessObjects Connector:- It allows organizations to connect to and access data stored in SAP BusinessObjects, a suite of business intelligence and         reporting tools developed by SAP. OData Connector:- This connector enables SAP systems to consume or publish data via the OData protocol, which is a standardized way to access data over      the web. RFC Connector:- This connector allows SAP systems to communicate with other SAP systems using the Remote Function Call (RFC) protocol, which enables function modules to be called across systems. IDOC Connector:- This connector is used to transfer data between SAP systems using Intermediate Documents (IDOCS), which are a standardized format        for exchanging data between systems.  BAPI Connector:- This connector enables SAP systems to expose business application programming interfaces (BAPIs) that can be used by external systems to access SAP data and functionality. EDI Connector:- This connector enables SAP systems to exchange data with other systems using Electronic Data Interchange (EDI), which is a standardized      format for transmitting data between different systems. Flat File Connector:- This connector allows SAP systems to import and export data in flat file format, which is a simple text-based format that can be used to      exchange data between systems. Microsoft Excel Connector:-This enables organizations to connect to and access data stored in Microsoft Excel spreadsheets These are just few Examples of data connectors available in SAP SAC. Each Connector enables organizations to connect systems and access data from SAP and Non-SAP systems. Steps to create Data Connections: – Open the data connection tool: This could be a built-in feature of the software you’re using or a third-party tool specifically designed for creating data connections. Firstly, we need to create a connection between SAP SAC and any other system. Choose + sign as shown below to create a new connection. On above-mentioned screen there are two options connections and scheduled status. In connections it will show all the active and inactive connections available. Many options are available on the right side of the screen, including creating a new connection, renaming connections, deleting connections, refreshing connections, sharing connections, and using a search bar to search for specific connections. Choose the type of data source: Select the type of data source you want to connect to from the available options. In the above-mentioned screen there is an option given to import live data from SAP sources and non SAP sources. There are some options that are visible for references. Enter the connection details: This may include the server name or URL, port number, database name, and other relevant information. In the above-mentioned screen in Name we need to add technical name of the connection and in description we can add actual source of data. In next line we need to add host link, port number, Client, User is and password to fetch data. Enter the credentials: Enter the login credentials or other authentication details Test the connection: Before saving the data connection, test it to ensure that it’s working properly. Save the connection: Once the connection is working correctly, save it so that you can use it in your data analysis or other tasks. SAP SAC Data Sources:- SAP SAC data sources provide users with the ability to access data from different sources and perform analysis on them. Here are some of the data sources available in SAP SAC: SAP HANA: This data source allows users to connect to SAP HANA databases and perform analysis on the data. SAP Business Warehouse (BW): This data source allows users to connect to SAP BW systems and perform analysis on the data. SAP ERP – SAP ERP is an enterprise resource planning software that provides integrated business processes across various functional areas. SAP SAC can extract data from SAP ERP using remote function calls (RFC). SAP S/4HANA – SAP S/4HANA is an intelligent ERP system that provides real-time insights and automation capabilities. SAP SAC can extract data from SAP S/4HANA using OData services or remote function calls (RFC). OData Services: This data source allows users to connect to any OData service and perform analysis on the data. JDBC Connector: This data source allows users to connect to any database that supports JDBC and perform analysis on the data. Cloud-based data sources – SAP SAC can extract data from cloud-based systems such as Salesforce, SuccessFactors, and SAP Concur. CSV File: This data source allows users to upload CSV files and perform analysis on the data. These are just few Examples of data connectors available in SAP SAC. Each Connector enables organizations to connect systems and access data from SAP and Non-SAP systems Create Query and convert it to a model Click on modeler (To Create a connection) -> Click on From a Data Source. In the mentioned screen above, users can create a model or upload data from a flat file, which converts to a model upon uploading. A Live Data Model enables users to establish real-time

SAP SAC: Unlocking the Power of Data Connection and Data Sources Read More »

SAP SAC integration with SAP BW/4HANA

Introduction Welcome to our blog, where we will delve into the exciting world of integrating SAP SAC (Analytics Cloud ) with other SAP products, focusing specifically on establishing a connection between SAP SAC and SAP Business Warehouse (BW). As organizations continue to leverage the power of data analytics to drive business success, the seamless integration between SAC and BW offers a dynamic and comprehensive solution for accessing, analyzing, and visualizing data stored in BW. Join us as we explore the step-by-step process of configuring this integration, unlocking the potential for enhanced reporting, real-time insights, and informed decision-making across your SAP landscape. 2 Types of connection: -Import: When there is a need to bring data from BW into SAP SAC for further analysis, modeling, and visualization, an import connection between SAP SAC and BW is necessary. Below we will explore the step-by-step process of configuring an import connection and setting it up in SAP SAC. -Live: A live connection between SAP SAC and BW is preferred when real-time access to BW data is critical for decision-making. Below we will explore the step-by-step process of configuring a live connection and setting it up in SAP SAC. Configuration of Import Connection between SAP SAC and BW/4HANA: To configure the data source in SAP SAC, follow these simple steps. 1.First, navigate to the “system” tab in the administration section. Next, click on the “data source configuration” tab, where you will encounter a variety of data sources to choose from. Scroll down until you find the SAP BTP core account option. Take note of the region host and sub-account user details displayed there, as they will be essential for the next step. 2.To establish a secure connection between your on-premise application and the cloud, a cloud connector is essential. This crucial tool acts as a handshaking application, facilitating a seamless link between the two environments. Before proceeding with the installation of the cloud connector, ensure that you have a SAP JVM ready. Locate or download the SAP JVM and make note of its file path, as you will need to specify this during the installation process. 3.Once you have the SAP JVM, extract it onto the server where you plan to install the Cloud Connector. As an example, you can unzip the file into the directory C:\SAP JVM\sapjvm_8. You can download it from this link: https://tools.hana.ondemand.com/#cloud 4.After obtaining the SAP JVM from the provided link, download the cloud connector from the same source. During installation, specify the folder location of the SAP JVM. 5.Once the installation process is complete, open your web browser and enter the following URL: https://localhost:8443. This will take you to the logon screen. Here, use the default credentials: “Administrator” for the username and “manage” for the password. It is recommended to change the password after your initial logon. At this point, you will be prompted to choose between a master and shadow installation. Opt for the “Master” option if you are installing a single Cloud Connector instance or the primary instance from a pair of Cloud Connector instances. 6.Next, enter the subaccount details that you noted earlier. Specify proxy host and port if using a proxy, otherwise leave blank. Optional to enter Location ID for multiple Cloud Connectors. Remember to save the configuration. 7.Once you have completed the necessary configuration, click on the “Connect” button. After doing so, verify that the connector state is displayed as “Connected.” This confirmation ensures that the Cloud Connector has successfully established. 8.When establishing connections with SAP BPC MS, SAP BW, SAP UNX, or SAP ERP systems, it is necessary to install the SAP Analytics Cloud agent in addition to configuring the Cloud Connector. However, for connections with SAP BPC NW, SAP BPC for BW/4HANA, OData, or SAP S/4HANA, configuring the Cloud Connector alone is sufficient. 9.To proceed with the installation of the SAP Analytics Cloud Agent, there is a preliminary step to follow. It involves downloading Apache Tomcat, a widely-used web server and servlet container, from the official website at https://tomcat.apache.org/download-80.cgi. Once the download is complete, simply double click on the Tomcat executable file to initiate the installation procedure. During this step, you will be prompted to accept the license agreement, an important formality. Moving forward, when presented with the Choose Components screen, it is recommended to stick with the default options, which are already configured optimally. And click next. 10.you need to specify the ports to be used by Apache Tomcat. It is essential to ensure that there are no conflicts with existing applications already running on your system. 11.Next, specify the path to your and install. 12.Once you have successfully installed Apache Tomcat, the next vital step in optimizing the performance of SAP Analytics Cloud Agent is to configure the JAVA Heap space allocation. Launching the Tomcat configuration allows you to modify these settings and allocate more memory accordingly. To initiate the configuration process, navigate to the Tomcat installation directory and locate the Tomcat8w.exe file. Simply double click on it to open the configuration window. By default, the initial and maximum heap space values (-Xms and -Xmx) are usually set to 128MB and 256MB respectively, which often prove insufficient for efficient data acquisition in SAC, leading to timeout errors. It is crucial to increase these values to prevent such issues. For enhanced performance, it is recommended to set the values to 1024MB and 2048MB respectively. 13.To install the SAP SAC (Analytics Cloud) agent, begin by downloading it from the SAP Support Portal: https://support.sap.com/swdc. Access the SAP Software Downloads page and navigate to “By Category.” Choose “SAP Cloud Solutions” and then select “SAP ANALYTICS CLOUD CONN SAP ANALYTICS CLOUD CONN 1.0 SAP ANALYTICS CLOUD AGENT 1.0.” Proceed to download the latest version available. 14.Once downloaded, unzip the file and rename the WAR file to C4A_AGENT.war. Extract the package and copy the C4A_AGENT.war file to the webapps directory in your Tomcat installation. When you restart Tomcat, the agent will automatically deploy. 15.To establish the authentication credentials needed for configuring the SAC Agent, follow these steps. First, locate

SAP SAC integration with SAP BW/4HANA Read More »

SAP Analytics Cloud: Predictive Analysis via inbuilt Machine Learning

Brief Overview of SAP Analytics Cloud Predictive Analysis & Machine Learning: SAP Analytics Cloud Predictive Analysis with Machine Learning is a powerful suite of tools and capabilities within SAP Analytics Cloud that empowers organizations to harness the potential of data for advanced analytics and decision-making. It combines predictive modeling, machine learning algorithms, and augmented analysis features to unlock valuable insights from data. By leveraging these tools, users can make accurate predictions, identify patterns, and optimize business processes.  Importance of leveraging data for decision-making: In today’s data-driven world, organizations face an abundance of data that holds tremendous potential for informed decision-making. The ability to extract meaningful insights from data and transform them into actionable intelligence is crucial for staying competitive. SAP Predictive Analysis with Machine Learning enables businesses to tap into their data resources, analyze historical patterns, and make predictions about future outcomes. By leveraging data for decision-making, organizations can optimize processes, mitigate risks, identify opportunities, and ultimately achieve better business outcomes. The rapid growth of data volume and complexity poses challenges in extracting actionable insights manually. SAP Predictive Analysis with Machine Learning addresses this challenge by providing automated and augmented analysis capabilities that streamline the process of data analysis and prediction. By leveraging the power of machine learning algorithms, organizations can uncover hidden patterns, generate accurate forecasts, and gain a deeper understanding of their data. This empowers decision-makers to make data-driven decisions based on reliable insights, improving the overall effectiveness and efficiency of their decision-making processes. Understanding SAP Analytics Cloud Predictive Analysis & Machine Learning    1. Definition and key features: SAP Analytics Cloud Predictive Analysis with Machine Learning is a comprehensive set of tools and features that empower organizations to leverage advanced analytics and machine learning capabilities within the Analytics Cloud platform. With these tools, users can perform predictive analysis, build predictive models, and derive valuable insights from their data. Key features include automated machine learning, data wrangling, R integration, collaboration, storytelling, and augmented analytics functionalities like Smart Discovery, Tables, and Time Series Charts. These features provide users with the ability to explore data, create predictive models, and visualize outcomes.    2.  How it helps in predicting outcomes and trends: SAP Predictive Analysis with Machine Learning enables organizations to forecast future outcomes and identify trends by leveraging historical data. With machine learning algorithms and predictive modeling techniques, users can analyze patterns, correlations, and variables to make accurate predictions. By uncovering insights and understanding relationships within the data, organizations can anticipate customer behavior, market trends, and operational patterns. These predictions aid in strategic decision-making, resource allocation, risk management, and planning processes. By harnessing the power of predictive analysis, organizations can gain a competitive edge by proactively addressing challenges and capitalizing on opportunities.    3. Integration with existing SAP systems: SAP Analytics Cloud Predictive Analysis with Machine Learning seamlessly integrates with existing SAP systems, such as SAP S/4HANA and SAP Business Warehouse (BW). This integration allows organizations to leverage their data assets stored within these systems and perform predictive analysis directly within the Analytics Cloud environment. By connecting to these systems, users can access relevant data sources, combine data from multiple systems, and apply predictive models to gain deeper insights. This integration enhances the usability and efficiency of the predictive analysis capabilities by leveraging the existing data infrastructure and ensuring data consistency across the organization. By utilizing the integration capabilities, organizations can tap into a wealth of data available in their SAP systems and leverage it for predictive analysis and machine learning purposes. This seamless integration streamlines the workflow and provides a holistic view of the data, enabling users to make data-driven decisions with greater accuracy and confidence. Benefits of SAP Predictive Analysis & Machine Learning 1. Improved accuracy in forecasting and planning: One of the key benefits of SAP Predictive Analysis with Machine Learning in Analytics Cloud is the improved accuracy in forecasting and planning. By leveraging historical data and applying advanced algorithms, organizations can make more accurate predictions about future outcomes. This accuracy is particularly valuable for demand forecasting, sales projections, and financial planning. With reliable forecasts, businesses can optimize inventory levels, allocate resources effectively, and make informed decisions to meet customer demands and maximize profitability. 2. Enhanced decision-making capabilities: SAP Predictive Analysis with Machine Learning empowers organizations with enhanced decision-making capabilities. By analyzing large volumes of data and extracting meaningful insights, decision-makers can make informed and data-driven choices. Predictive models and machine learning algorithms provide valuable insights into customer behavior, market trends, and potential risks. This enables businesses to identify opportunities, mitigate risks, and develop strategies that align with market dynamics and customer preferences. The result is more effective decision-making, improved business outcomes, and a competitive edge in the market. 3. Optimization of business processes: Another significant benefit of SAP Predictive Analysis with Machine Learning is the optimization of business processes. By analyzing historical data, organizations can identify inefficiencies, bottlenecks, and areas for improvement within their operations. Predictive analytics helps optimize supply chain management, production planning, and resource allocation. By understanding demand patterns, organizations can streamline inventory management, reduce stockouts, and optimize procurement processes. Furthermore, predictive models can optimize maintenance schedules, minimizing downtime and maximizing equipment utilization. Overall, this optimization of business processes leads to cost savings, improved efficiency, and increased customer satisfaction. 4. Identification of patterns and anomalies: SAP Predictive Analysis with Machine Learning enables organizations to uncover valuable patterns and anomalies hidden within their data. By analyzing historical and real-time data, businesses can identify trends, correlations, and outliers that may go unnoticed through traditional analysis methods. This identification of patterns and anomalies has several benefits. It helps detect fraudulent activities, such as financial fraud or security breaches, allowing organizations to take timely action. Moreover, it enables businesses to understand customer behavior, preferences, and segmentation more accurately, leading to targeted marketing campaigns and personalized customer experiences. By uncovering hidden insights, organizations can gain a competitive advantage, make proactive decisions, and mitigate risks effectively. Use of Augmented Analytics in Analytics Cloud: Smart Discovery: Smart Discovery is a

SAP Analytics Cloud: Predictive Analysis via inbuilt Machine Learning Read More »

SAP Analytics Cloud (SAC) – Healthcare Analytics

Introduction: In the context of SAP Analytics Cloud healthcare, due to increasing expenditure on health resources, access, services, and demographic changes, healthcare systems worldwide are under stress. Companies should be leveraging all available data and analytics capabilities to promote flexibility and adaptability, especially in this “new normal” where COVID-19 has severely disrupted demand for PPE, drugs, and medical equipment. The primary goal for every hospital and clinical department is to achieve high-quality medical results and access real-time information regarding quality indicators, utilization, performance data, as well as personal data, presented in a clear, easy-to-monitor, and easy-to-interpret manner. These significant, quick variations in demand can be accommodated through reporting and analytics performed via SAP Analytics Cloud. In general, life sciences businesses should spend money on tools like SAP Analytics Cloud to have access to a platform for business analytics, remote collaboration, and forecasting, especially those in the pharmaceutical and medical device industries. How SAP Analytics Cloud works in the Healthcare Department: SAP SAC Analytics dashboard provides an overview into different units within a hospital including Finance, Patient Care, operations like salary & expenses, admissions, discharges, total beds, and other staff to help healthcare leaders plan for the future. Finance Forecasting: – Healthcare departments can plan for the future and recognize potential financial risks with the help of SAC’s predictive analytics, which can be used to forecast future revenue and expenses. SAC’s is the platform to identify trends and patterns in historical financial data by using predictive modeling approaches. In order to evaluate the effects of numerous factors, including changes in patient volumes, payment rates, and staffing levels, SAC also develops several scenarios. This can assist healthcare departments in understanding the potential financial risks connected to certain scenarios and making the necessary plans. SAC could employ real-time data from a variety of sources, such as patient admission records and various claim information, to provide current insights on financial performance. As a result, the healthcare environment would shift, which might assist healthcare agencies in revising their estimates. Patient care analysis: – SAC Analytics may assist healthcare departments in monitoring patient results, identifying patterns, trends of health condition, and making data-driven patient care decisions. It can also consolidate data from electronic health records to provide actual insights into patient outcomes. Which may assist healthcare departments in tracking patient progress, identifying areas for improvement, and changing treatment plans as needed. As a result, healthcare departments can improve personnel levels and reduce expenses by examining patient data and finding areas of high utilization. Supply chain analysis: – SAP Analytics can be applied to inventory management, supply chain management, and procurement process improvement. By employing it, the user has complete visibility into the supply chain’s activity. This can help healthcare organizations cut down on waste, boost productivity, and guarantee that crucial supplies are always available. Healthcare departments can monitor and evaluate their supply chain and procurement operations’ key performance indicators (KPIs) with the help of SAC Analytics. By tracking KPIs like inventory turnover, order fulfillment time, and supplier performance, healthcare departments are able to identify areas for improvement and make data-based decisions rather of ones based solely on intuition. This allows them to maximize their operational efficiency. Operational analysis: – SAC Analytics provides users with complete access to Important data such as patient wait times, personnel levels, and resource utilization. By monitoring these indicators, healthcare departments can discover inefficiencies and obstacles in their operations and take action to address them. For example, it can assist healthcare departments in optimizing personnel numbers and scheduling to ensure that the right staff is in place at the right time. Healthcare departments can make informed choices about scheduling and staffing levels, ensuring that they have the resources to satisfy patient requests, through analyzing data on patient volumes and demand trends. Regulatory compliance analysis: – Users using SAP Analytics have complete access to crucial information like resource usage and patient wait times. Healthcare departments can detect inefficiencies and operational bottlenecks and take corrective action by tracking these data points. For instance, it can assist healthcare departments in optimizing personnel counts and scheduling to make ensuring the proper individuals are present at the appropriate time. By examining data on patient numbers and demand patterns, healthcare departments can make data-based choices on staffing levels and scheduling, ensuring they have the resources to satisfy patient requests. More precisely, by employing SAP Analytics health department may verify compliance with regulatory standards, and can identify issues or gaps in their compliance processes and also take appropriate action. Conclusion: – SAP Analytics can provide healthcare businesses with an extensive collection of tools for data analysis and visualization. Healthcare firms may get important insights into their operations, enhance resource use, improve patient care, and maintain regulatory compliance through the use of SAP Analytics. SAP Analytics is a valuable tool for healthcare organizations that want to make data-driven choices, enhance patient outcomes, and cut costs. Healthcare firms can gain a competitive advantage and deliver better care to their patients by utilizing the power of SAP Analytics. To read more of our blogs surely click here.   check out other video blogs  Disclaimer: All the opinions are solely for information purposes and the author doesn’t recommend or reject any tools. It should be done after your own due diligence.

SAP Analytics Cloud (SAC) – Healthcare Analytics Read More »

sap sac Unified Story Features

SAP Analytics Cloud (SAC) – Unified Story Features

Introduction: The Optimized Story Experience from Unified Story in SAP Analytics Cloud(SAC) is a cutting-edge solution for creating and managing data visualizations, analytics applications, and interactive experiences. This innovative platform combines the best features of stories, analytics designers, and custom widgets with advanced scripting capabilities, allowing users to create highly customized projects tailored to their specific needs. One of the key benefits of the Optimized Story is its versatility. It offers a wide range of capabilities, from simple self-service data visualization to more advanced analytic applications, all in one place. This makes it an ideal tool for anyone looking to create dynamic and engaging visualizations and applications, regardless of their level of experience or expertise. Moreover, the Optimized Story makes it easy for developers and story designers to collaborate on projects, and for administrators to manage them. This streamlined workflow not only saves time and resources but also ensures that everyone involved in the project is on the same page. One of the most exciting features of the Optimized Story is its ability to bookmark the entire widget state. This means that users can easily revisit and resume their work exactly where they left off, without having to start from scratch. This feature not only saves time but also enhances the user experience, making it easier to navigate and manage complex projects.  Integrated Design Time for Both Designer and Developer Story Widgets, such as panels, tab strips, page books, input fields, text areas, buttons, dropdowns, checkbox groups, radio button groups, sliders, range sliders, filter lines, and list boxes, were previously only available in analytics applications. Now, you can use them in stories as well.              Story designers and developers now have a single, integrated design environment to collaborate in, making it easier and faster to create interactive stories. This environment includes the Assets panel, which allows users to drag and drop widgets onto the Story Canvas, and The Outline panel provides a structured view of the widgets in the story Advanced features such as filter controls, containers, buttons, scripting and eventing, performance analysis for scripting execution, and editing of Cascading Style Sheets (CSS) are available for those with the Application privilege. All of this is designed to keep the environment simple and clean for the story designer while allowing developers to leverage more advanced features. But be aware, scripting is not yet supported for responsive pages, but this is planned for the QRC2/2023 Release. Filter Panel Story viewers now have more flexibility when interacting with filters in a story. With the introduction of the new orientation feature, the filter panel can be switched from the default horizontal view to a vertical view. This vertical view offers more space for displaying and interacting with filters, especially when dealing with hierarchical value lists. Story designers can easily configure the default orientation that viewers will see when they open the story. Bookmarks Concept Optimized Story combined the concept of a story bookmark and an analytics app into one cohesive bookmark. Consumers of stories can bookmark the entire widget state, including the filter, variable, and drilldown. Optimized Story also introduced bookmark versions, which give users the option to adjust when their bookmarks expire. Additionally, story developers can define which widgets can be included in the bookmark definition. Furthermore, they can enable the bookmark dialog in embedded mode at the story level through View Time Toolbar Settings. Conversion Classic to the new Optimized Story The introduction of the Optimized Story Experience has revolutionized the process of creating stories. This new feature has made it easier and more efficient for story designers and developers to convert their classic stories into a more modern format with just a single menu option. With the Optimized Story Experience, users no longer have to spend hours manually converting their classic stories to the new format. Instead, all they need to do is open the story in the new Unified Story Experience, and the system will automatically convert it to the new format. This makes the process of creating stories much more streamlined, allowing designers and developers to focus on creating engaging content rather than worrying about formatting and conversion issues. In addition to its conversion capabilities, the Optimized Story Experience also offers a range of tools and features that make it easier to create engaging stories. These include drag-and-drop interfaces, intuitive menus, and real-time preview capabilities that allow users to see exactly how their stories will look and feel on different devices. Overall, the Optimized Story Experience represents a major step forward in the world of digital storytelling, making it easier and more accessible than ever before. Whether you’re a professional storyteller or just getting started in the field, this new feature is sure to help you create compelling, immersive stories that captivate your audience and keep them coming back for more. Conclusion Unified Story Experience is a new and improved way to create Dashboards in SAP Analytics Cloud. The Optimized Story Experience from Unified Story is a revolutionary tool that transforms the way users create and manage data visualizations and analytic applications. It leverages the power of stories, analytics designers, and custom widgets with scripting capabilities to provide a plethora of features that enable story designers to personalize their projects. Moreover, the integration of story widgets, filter panel, and bookmark concept enhances accessibility and efficiency for designers and developers alike. With its sophisticated functionality and user-friendly interface, the Optimized Story Experience is the ideal solution for designing captivating and dynamic visualizations and applications that elevate dashboard and planning activities to new heights. This is a major step forward toward the new generation of Dashboarding in SAP Analytics Cloud. Happy Dashboarding!   To read more of our blogs you can surely click here. check out other video blogs  Disclaimer : All the opinions are solely for information purposes and the author doesn’t recommend or reject any tools .You should do it after conducting your own due diligence.    

SAP Analytics Cloud (SAC) – Unified Story Features Read More »

SAP Analytics cloud (SAC) – Custom Widgets (Part I)

Introduction: In today’s rapidly evolving digital landscape, businesses require access to real-time data and insights to make informed decisions. Analytical apps have become a vital tool for businesses, but they must be user-friendly and provide relevant information in a clear and concise manner to be effective. By incorporating a SAP Analytic Cloud (SAC) into your analytics applications, you can enhance the user experience. The SAP Analytics Cloud Custom Widget functionality allows you to add unique widgets to the analytics designer’s already available widget collection, making it ideal if your analytics application requires specific user interface elements, data visualizations, or capabilities that are not offered by the standard collection of widgets. Custom widgets can be created without the need for specialized software, although a robust JavaScript text editor can streamline development efforts as widgets become more complex. SAP Analytics Cloud is a comprehensive cloud solution that integrates enterprise planning, enhanced analytics, predictive analytics, and business intelligence into a single platform. It offers reliable data connections, a variety of visualization tools, enhanced analytical capabilities, and financial planning features. With this single cloud system, you can analyze, inquire, predict, plan, and report, making it a valuable asset for businesses in today’s fast-paced and competitive environment. What is SAC Analytic Application Custom Widgets? The SAP Analytics Cloud Custom Widget framework provides you with the power to create your own unique widgets that can be integrated with the predefined set of widgets available in the analytics designer. This feature proves to be extremely useful when you require a particular user interface element, a customized data visualization, or specific functionality that is not available in the existing collection of widgets. Incorporating custom widgets into the analytics designer in SAP Analytics Cloud is a smooth and effortless process. These widgets function and appear alongside the preconfigured widgets in the widget palette. The only difference is that they are designed by third-party vendors or customers instead of being exclusively developed by SAP developers. How SAC Improves Analytic Application by Custom Widgets? ·       SAP Analytics Cloud (SAC) transforms the world of analytics by providing an effortless way for users to create and personalize widgets that cater to their specific needs. The platform’s intuitive drag-and-drop interface allows users to seamlessly create charts, tables, and other visualizations while accessing data from diverse sources, including both SAP and non-SAP systems. This not only enhances the user experience but also guarantees the accuracy and relevance of the analytics. ·       One of the major advantages of utilizing custom widgets in SAC is the ability to develop dynamic and interactive dashboards that facilitate a deeper understanding and clearer communication of data. By creating widgets that feature interactive charts, users can easily filter data, drill down into specific data points, and explore information in a variety of ways, empowering them to identify trends, patterns, and outliers more efficiently. This, in turn, enables users to make more informed and actionable decisions. ·       Creating custom widgets is a breeze with SAC’s built-in drag-and-drop interface, which allows users to quickly develop charts, tables, and other visualizations. SAC also provides a broad range of built-in data visualization options, such as bar charts, line charts, scatter plots, and heat maps, among others, enabling users to create visualizations tailored to their specific data and use cases. ·       SAC’s collaborative environment empowers users to create and share custom widgets with ease. Sharing and reusing widgets across teams and projects streamlines the creation and maintenance of analytics applications, leading to consistency and quality in analytics. ·       Moreover, SAC’s cloud-based platform enables users to access analytics applications and data from anywhere and at any time, improving the flexibility and scalability of analytics applications while reducing the cost and complexity of managing and maintaining analytics infrastructure. ·       Finally, SAC provides real-time analytics, allowing businesses to access data and insights immediately and make timely, informed decisions. In today’s fast-paced business environment, where swift decisions are crucial for remaining competitive, SAC provides a game-changing solution. How to create Custom Widgets? Web Components are used to implement customized widgets. The fundamental concept behind web components is to offer unique HTML elements—so-called custom elements—that don’t conflict with the rest of the HTML DOM (Document Object Model) of a web page. In actuality, custom element styling and rendering are completely separate from the rest of the HTML DOM. This is accomplished by creating a shadow DOM that divides the HTML DOM of a custom element from the HTML DOM of the web page. A custom widget is made up of two different sorts of files from the hosting perspective: the resource files and the custom widget JSON file.  The custom widget: the metadata for a custom widget is contained in a JSON file. It lists every component of a        custom widget and uses the URLs of its resource files to refer to them. The resource files are all the files which enables the proper working of the widget, for example, JavaScript files, CSS files, HTML files, image files, etc. To upload a custom widget to the analytics designer in SAP Analytics Cloud, there are a few prerequisites and steps that must be followed. First, ensure that you have the necessary permissions to create and upload custom widgets. This means that the “Create” permission for Custom Widgets must be selected in your assigned role. Once you have the proper permissions, you can begin the process of uploading the custom widget. Start by navigating to the “Custom Widgets” tab on the Analytic Applications start page. From there, select the option to “Create” a new widget. A dialog box will appear, allowing you to choose the file you wish to upload. Select the appropriate custom widget file, such as “box.json”. After the widget has been successfully uploaded, it will be available for use in your analytic application. You can find it by navigating to the “Add” option and selecting “Custom Widgets” from the menu. Conclusion: In conclusion, custom widgets are an essential feature of SAP Analytics Cloud that can help

SAP Analytics cloud (SAC) – Custom Widgets (Part I) Read More »

SAP Analytics Cloud (SAC)- How to set up a landing page for the SAC dashboard

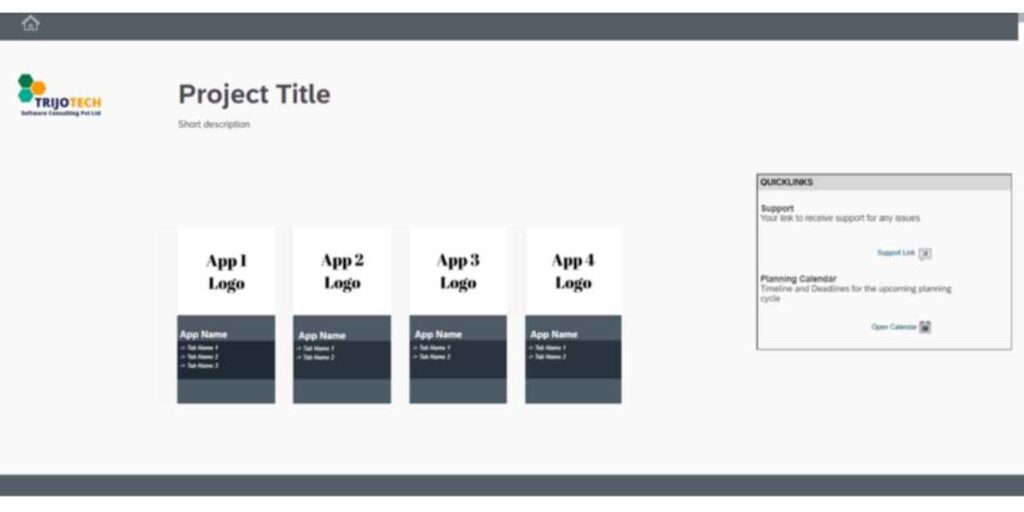
Introduction: SAP Analytics Cloud is a powerful tool that enables organizations to create and share interactive dashboards, reports, and data visualizations. One essential component of an analytics solution is a landing page. It is the entry point to the SAP Analytics Cloud project. It is designed to provide users with an overview of the project and redirect them to different components of the project. In this blog, we will explore how to create a landing page in SAP Analytics Cloud. We will cover the key components of a landing page, including its purpose, design, and functionality. Whether you are new to SAP Analytics Cloud or an experienced user, this blog will provide you with the knowledge and skills necessary to create an effective landing page that meets the needs of your organization. The process of setting up a landing page for your SAP SAC Landing Page You can use several widgets to create a landing page. To set up the UI for your landing page you can start with creating custom header and footer where you can place a logo, a search bar, and navigation buttons in the header panel, while placing links to social media accounts, support pages, and legal disclaimers in the footer panel. The main canvas of the landing page is where you can add widgets to showcase your project title, description, and company logo. You can also include icons that redirect users to other applications or stories within SAC. This helps to create a consistent user experience and navigation flow within SAC. To understand better, we will be creating a simple landing page as shown in above figure. 1.Steps to create Navigation Buttons: 1.1.    Use a Flow Layout Panel to place your navigation buttons. A flow layout panel is a type of container that allows you to arrange widgets in a flow direction, either vertically or horizontally. To implement this layout in your application, you should create a new Flow Layout Panel and name it “main”. Then, you can add four other Flow Layout Panels inside the “main” panel. These four panels will be arranged in a flow direction within the “main” panel, creating a nested layout. The advantage of using a Flow Layout Panel is that it allows you to easily adjust the layout of the widgets as the size of the container changes. The widgets   will automatically flow to the next line or column as needed, without overlapping or becoming misaligned. This can make your GUI more flexible and responsive to different screen sizes and resolutions, improving the user experience.   1.2.    When using multiple Flow Layout Panels to arrange controls, you may want to add some space or a gap between them to enhance the overall layout and presentation of the user interface. To achieve this, you can insert another Flow Layout Panel in between two existing ones, and this intermediate panel will serve as the gap or spacing element. It’s common practice to name these gap panels as FlowLayoutPane gap to differentiate them from other  panels in the layout. 1.3.  Inside FlowLaoutPanel_1, add the two panels, first add a normal panel and set the properties of this newly created panel to  accommodate the application logo, such as its size and position. The same process should be followed to add the second panel for the application description. This panel  should be positioned below to the panel for the logo and can also be customized to include appropriate text, fonts, and colors to enhance its appearance. 1.4.  follow a similar process for customizing the other three panels. The figure referred below shows an example of what the navigation panel should look like after customization. 1.5.  Now the user interface (UI) of the landing page has been created, the next step is to add links to the navigation buttons that were created earlier. These links will redirect the user to the respective applications or sections of the project.   There are two ways to add links to these navigation buttons, depending on the user’s requirements:   1.5.1.Using a static link The first method is to use a static link, which is a link that does not change and always points to a specific URL. To add this link, click on the three dots that appear on panel and select add hyperlink. Then copy paste your link here. 1.5.2.Using a dynamic link The second method is to use a dynamic link, which is a link that is generated dynamically based on the user’s input or other factors. For example, a dynamic link may be generated based on the user’s selection of a new bookmark. This method is useful when the destination URL changes frequently and needs to be updated automatically. To create dynamic links in the SAP Analytics Cloud (SAC) platform, a standard function named “NavigationUtils.openApplication()” is provided. This function takes a few parameters that define the URL and any additional parameters that need to be passed to the destination page. You can place this function in onclick script of panel. For example: NavigationUtils.openApplication(“appid”,[UrlParameter.create(‘mode’,’embed’), UrlParameter.create(‘bookmarkId’,’DEFAULT’)],false); The first parameter of this function is the “appid,” which is a unique identifier for the destination URL. The second parameter is an array of URL parameters that can be passed to the destination URL. These parameters can be used to specify the mode of operation or any other context information that needs to be passed to the destination page. In the example given, two URL parameters are being passed to the destination page, namely ‘mode’ and ‘bookmarkId.’ The third parameter of this function is a Boolean value that indicates whether to open the destination page in a new tab or not. If the value is true, the destination page will open in a new tab. If the value is false, the destination page will open in the current tab. With this script the current application bookmark is opened in the same tab. 2.Steps to create Header and Footer To create header and footer, you can simply add sub-panels to the main panel. For example, you might create a toolbar in the header by adding a sub-panel

SAP Analytics Cloud (SAC)- How to set up a landing page for the SAC dashboard Read More »

SAP Analytics Cloud (SAC) – Overview

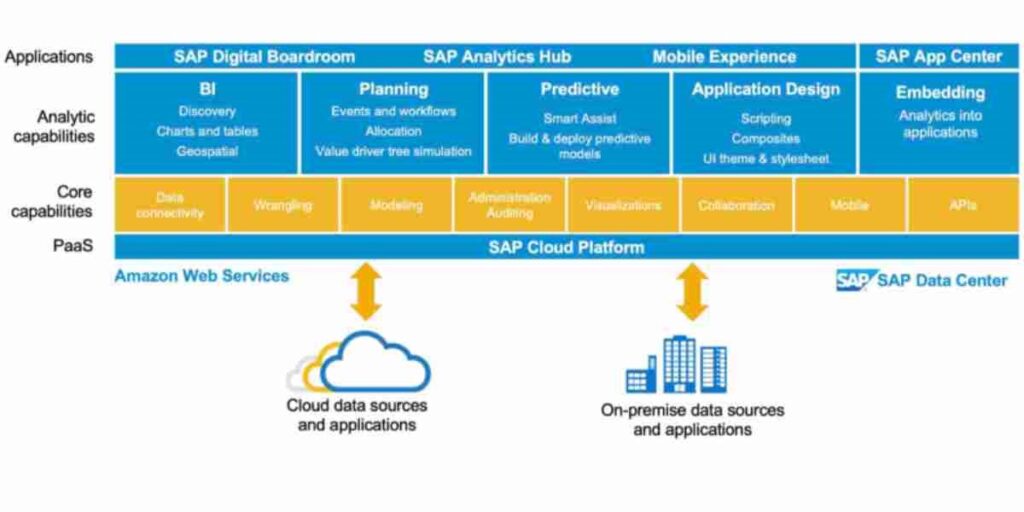
Introduction:  In today’s data-driven world, businesses are constantly seeking ways to gain actionable insights from their vast amounts of data. Are you looking for a cloud-based solution that can help you understand your data, make smarter decisions, and plan for the future? If so, SAP Analytics Cloud (SAC) emerges as a powerful solution. It’s a brawny and versatile analytics platform that is empowering organizations by combining business intelligence, augmented and predictive analytics, and planning capabilities in one end-to-end workflow.  In this blog post, we will explore the key features and benefits of SAP Analytics Cloud, highlighting how it can revolutionize your data analytics strategy.  What is SAP Analytics Cloud?  SAP Analytics Cloud is a cloud-based enterprise analytics solution, belonging to the SAP BTP platform, that delivers planning, predictive analytics, and business intelligence capabilities in one integrated workflow. It connects to data sources across on-premises and cloud environments, to provide a comprehensive and unified view of your organization’s data. Additionally, it also enables you to connect and analyze data from SAP and non-SAP applications, whether they are live or imported. It also provides you with over 100 ready-made SAP business content packages that cover various lines of business and industries, so you can speed up your analytics and planning projects. It also allows you to collaborate with your teams on plans and budgets, using real-time data and simulations to align your strategies and goals.  Data Sources supported by SAP Analytics Cloud:   Different types of data sources that you can use with SAP Analytics Cloud: You can connect SAP Analytics Cloud (SAC) to many different data sources, both in the cloud and on your own premises. Some of the data sources that SAC can connect to are:  Leverage data from SAP BW, SAP Universe, SAP HANA, Google BigQuery, SAP BPC, and SQL sources. Harness the capabilities of SAP S/4HANA, SAP BPC Embedded, and SAP Data Warehouse Cloud. Seamlessly integrate with cloud applications such as SAP SuccessFactors, Concur, and Qualtrics. SAC can connect to these data sources using two methods: live connection and data acquisition. Live connection means that the data is retrieved from the source system upon opening or refreshing a story in SAC, while data acquisition means that the data is replicated from the source system into SAC.  For real-time data connectivity options, SAC can use live connection for some of the data sources mentioned above, such as SAP BW, SAP S/4HANA, SAP HANA, SAP Universe, SAP BPC Embedded, and SAP Data Warehouse Cloud. However, not all data sources support live connection, such as SAP SuccessFactors and other cloud applications. In that case, SAC can use SAP Data Warehouse Cloud as a bridge to expand the live connection options via remote connections. SAP Data Warehouse Cloud can connect to a variety of SAP and non-SAP data sources remotely and federate the data in models that can be accessed by SAC in real time.  Open data sources: You can also use SAC with open data sources, such as CSV files, JSON files, and XML files. SAC also supports other data connectors that let you connect to custom data sources that SAC does not support natively. SAP Analytics Cloud (SAC) provides access to various data sources, both on-premise and cloud-based.  SAC Architecture in a nutshell:  SAP Analytics Cloud (SAC) is a platform that can do business intelligence (BI), enterprise planning, and predictive analytics by itself. SAP hosts and runs this service fully. The SAC architecture has three layers:  The core layer is the base of the SAC platform. It has the SAP HANA database, the SAP Analytics Cloud application server, and the SAP Analytics Cloud web application.  The data layer lets SAC connect to different data sources, such as SAP applications, data sources on your premises, and data sources in the cloud.  The user layer is the interface for users to work with SAC. It has the SAP Analytics Cloud web application, the SAP Analytics Cloud mobile app, and the SAP Analytics Cloud SDK.  The diagram below shows the main architecture of SAP Analytics Cloud:  The core layer of the SAC architecture is hosted in SAP’s data centers. The data layer can be hosted in SAP’s data centers, on-premises, or in a hybrid environment. The user layer can be accessed from any device with a web browser.  Key Features:  Data Integration:  SAC facilitates seamless data integration from diverse sources, encompassing SAP systems, databases, spreadsheets, and cloud applications. This enables consolidation of structured and unstructured data for holistic analysis. Data Integration in SAP Analytics Cloud entails linking and analyzing data from a range of sources, including SAP and non-SAP applications, files, or databases. Leveraging the SAP Analytics Cloud Modeler, users can prepare, transform, and model data for analysis and planning purposes. Moreover, the SAP Analytics Cloud add-in for Microsoft Office offers additional functionality for accessing and enhancing data within Excel. Furthermore, integration of SAP Analytics Cloud with SAP S/4HANA Cloud supports planning and reporting objectives. Data Visualization:  With SAC’s intuitive drag-and-drop interface, users can create compelling visualizations and interactive dashboards. The platform offers a wide range of chart types, widgets, and formatting options to present data in a visually appealing and meaningful way. One can use various types of charts, graphs, maps, and tables to visualize your data in SAP Analytics Cloud stories and dashboards.             Advanced Analytics:  Data visualization in SAP Analytics Cloud is the process of creating and displaying graphical representations of your data to communicate insights and trends. SAC goes beyond traditional BI by incorporating advanced analytics capabilities. One can leverage predictive analytics, machine learning algorithms, and natural language processing to uncover hidden patterns, perform forecasting, and make data-driven predictions. You can use various types of charts, graphs, maps, and tables to visualize your data in SAP Analytics Cloud stories and dashboards             Planning and Budgeting:  With SAC, organizations can simplify and improve their financial planning processes. SAC offers robust planning and budgeting functionalities, enabling organizations to streamline their financial planning processes. It facilitates collaborative budget creation, what-if scenarios, and variance analysis,

SAP Analytics Cloud (SAC) – Overview Read More »

SAP Analytics Cloud – Implementing SAC for Retail Industry

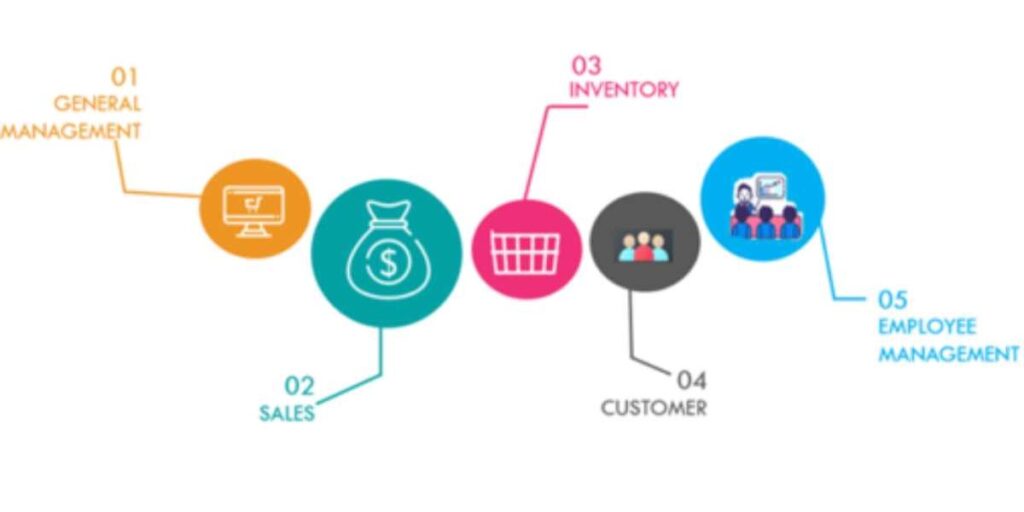
Introduction Gathering from the years of experience of our expert BI / Analytics consultants who have worked with the world’s leading retailers in architecting, implementing & optimizing their BI & Planning solutions. Today, we bring to you some insights into the industry practices across the retail industry in managing their enterprise performance suite and we will see how SAP Analytics Cloud (SAC) fits in the overall picture. We will also address the topic of how SAC can enhance the existing SAP landscape to enable businesses to make better-informed decisions. But before that, let’s outline few common requirements, as well as the KPIs, used across multiple retail clients that we’ve worked with: Requirements/KPIs Used: Many of our retail clients have a physical location / Store / Plant or we can say profit centers where the majority of the sale happens. This calls for a chargeable area as one of the most important drivers used across multiple KPIs. A major chunk of retail clients’ expenses consists of the occupation cost, so this ratio of sales per square feet and similar KPIs which involve chargeable area are important. This concept is a proxy to unit economics and its threshold values vary across geographies owing to the occupation cost per square foot. Besides the Brick & Mortar model, many of our retail clients deal with multiple business partners such as e-commerce partners, etc. An Omni-channel approach to the retail business is required, and reporting such sales constitutes a whole other gamut because the cost of such sales cannot be compared with the ones done with the brick-and-mortar model. And one of the major indicators of annual performance in the Retail industry is like to like-to-like or LTL growth of the business. Such reports are important to understand the actual performance improvement in the stores that were already operating under a given retail company for over a year. In addition to the above requirements, the next segment discusses the number of common KPIs tracked across almost all the retail clients that we’ve worked with. KPI’s every Retail Manager needs to track Understanding which KPIs are the most important for your business to track is the first step in designing a BI solution. Based on the usage across multiple functional units in an organization, we can classify the KPIs required in a retail company into 5 main categories: General Management Analytics This includes the key financial metrics that allow managers in retail to track the overall performance of the business and call for action in case the KPIs are aberrant. Net Profit Margin It measures the percentage of profit made after deducting all the expenses, interests, depreciation, and taxes from revenue. It represents how good the company is at converting revenue into profits. Margin % Retailers sell a product mix and plan margin % instead of COGS. Different product types have different margins % and this KPI helps track whether the company is in the standard range of margin. This information is key in determining how to outsell the competition. Gross Profit This metric represents the retail’s financial health and shows how successful the organization is at generating a high return. The difference between the Sales Revenue and COGS calculates it. Gross Margin Return on Footage (GMROF) GMROF shows the relationship between total sales corresponding to per square feet area of the store. Gross Margin Return on Labor (GMROL) GMROL is a measure of employee productivity that expresses the relationship between gross margin and FTE. It explains the profit gained by an FTE in a specific period of time. Sales Analytics KPI tracking linked to sales activities helps to increase the performance of your stores by taking corrective measures if the sale is plummeting. Their monitoring over time allows retail managers to do sales forecasts. Sales year over year Growth Sales growth is the percent growth in the net sales of a business from one fiscal period to another. Sales Per Square Foot Sales per square foot is one of the best metrics for gauging and comparing the performance of brick-and-mortar stores. It’s a good indicator of store productivity, and it can also tell you if you’re making good use of space and fixtures in your shop. Sales Per Employee This metric will give you an important point of view about how efficiently employees are being utilized. Conversion Rate This generalized KPI offers insight into what turns visitors into customers. Marketing campaigns can get people to stores but the only way to grow is to ensure visitors convert into paying customers. Retail Sector Key KPI’s Inventory Analytics Retail inventory management enables store managers to quickly analyze the stock of different articles, optimize it, and offer customers excellent services. A few key KPIs are: Inventory Turnover / Stock Turn Stock turn is a critical metric for determining optimal inventory levels. If the stock turn is too low, then it means you’re not selling out of inventory fast enough and risk carrying slow or dead stock. If the stock turn is fast then it could mean that customers are continually dealing with out-of-stock issues. Gross Profit Margin Return on Investment (GMROI) This metric is an inventory profitability evaluation ratio that measures the profit return on the funds invested in the stock. It measures for each dollar invested in inventories how many dollars your company has been able to recover. Sell-through Sell-through is a great way to evaluate merchandise performance. It also helps you figure out the speed at which a product is selling so you can make the right purchasing decisions. Shrinkage Shrinkage pertains to a loss of inventory that isn’t caused by actual sales. The common causes of shrinkage are employee theft, shoplifting, administrative errors, and supplier fraud. Customer Analytics 1. Customer retention The customer retention definition is the process of engaging existing customers to continue buying products or services. The best customer retention tactics enable you to form lasting relationships with consumers who will become loyal to your brand. 2. Average Customer Spend This KPI metric offers to understand deeply the client’s segment. This data

SAP Analytics Cloud – Implementing SAC for Retail Industry Read More »

Scroll to Top